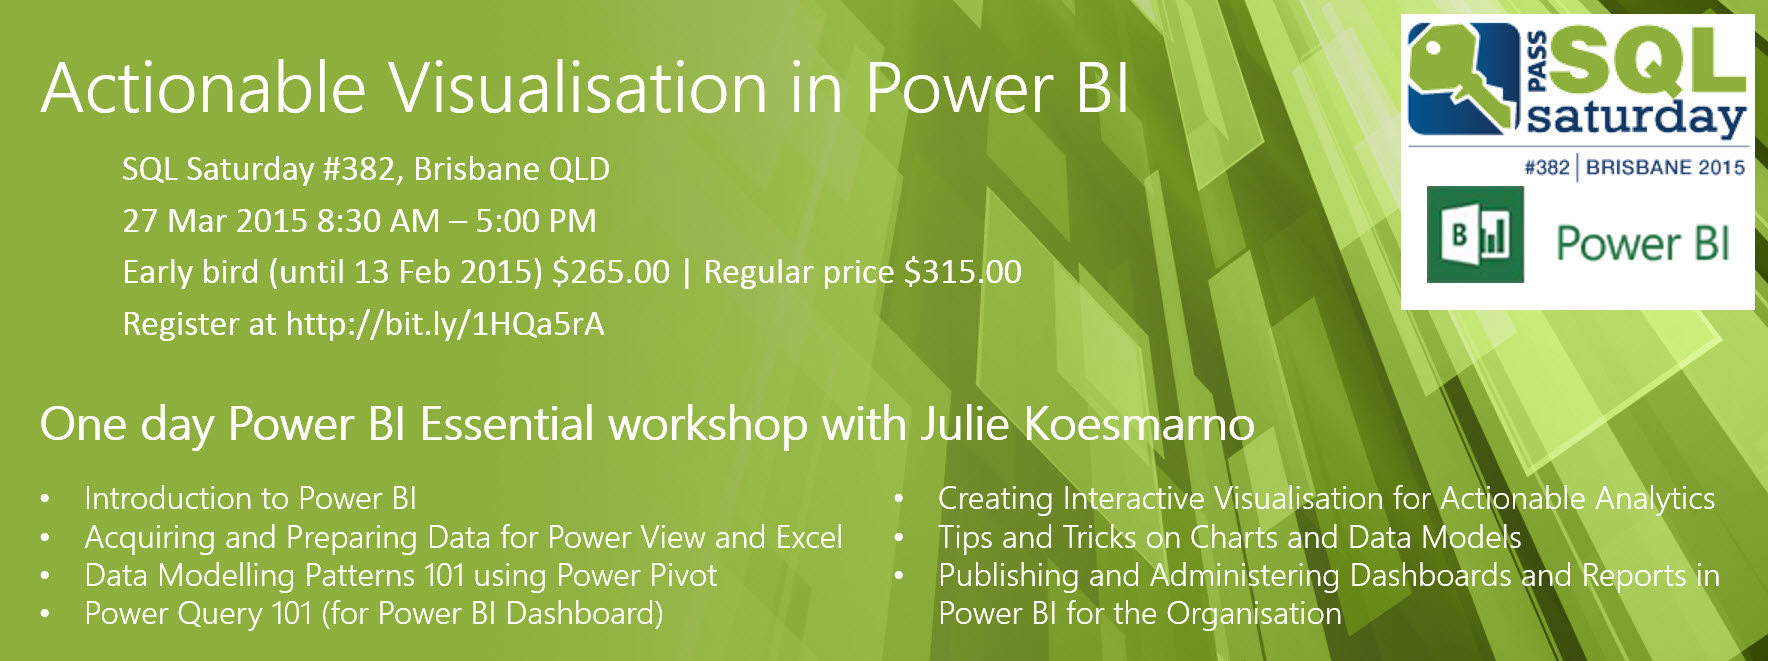
I’m pleased to announce that I will be delivering a one day workshop as one of the two precons at SQL Saturday 382, Brisbane. The details of the course are listed below. I look forward to seeing you in Brisbane!
Actionable Visualisation In Power BI
SQL Saturday 382 Brisbane, QLD
27 Mar 2015 8:30 AM – 5:00 PM
Early bird (until 13 Feb 2015) $265.00
Regular price $315.00
Register at http://bit.ly/1HQa5rA
Modules
- Introduction to Power BI
- Acquiring and Preparing Data for Power View and Excel
- Data Modelling Patterns 101 using Power Pivot
- Power Query 101 (for Power BI Dashboard)
- Creating Interactive Visualisation for Actionable Analytics
- Tips and Tricks on Charts and Data Models
- Publishing and Administering Dashboards and Reports in Power BI for the Organisation
About the Speaker: Julie Koesmarno
Julie Koesmarno, SQL Server MVP, MCSE Data Platform, MCSE Business Intelligence, Microsoft Certified Trainer, is a SQL Server and BI consultant, with a Bachelor’s degree in IT. She has over 10 years of experience working with SQL Server for large-scale and multi-million-dollar OLTP and ETL projects as a SQL Server developer and system analyst/designer. Her recent projects include delivering a SQL Server 2012 Data Warehouse and BI solutions for a number of high profile clients in the US and Australia.
Introduction to Power BI
In this module, we will walk through core components of Power BI and the various scenarios where Power BI is at its best as Software-as-a-Service (SaaS). We will introduce the possibilities of hybrid architecture leveraged by Power BI. Attendees will learn the differences between the self-service capabilities offered as on-premise Vs cloud based, and why and when they are important for analytical, operational and strategic reports.
Acquiring and Preparing Data for Power View and Excel
The first step before creating data visualisation using Power View and Pivot Tabes/Charts in Excel, we need to acquire the data from various data sources. In this module, attendees will learn top tips and tricks of acquiring and preparing data for Power View and Pivot Tables/Charts.
Using live demo’s, attendees will be aware of the various data sources that are supported to create Power BI and Excel, and how to get them into the data model (Power Pivot). We will have a look at a number of samples of Power View reports and how to prepare the model appropriately for basic and user friendly Power View visualisation and Pivot Tables/Charts.
Data Modelling Patterns 101 Using Power Pivot
Continuing the previous module, attendees will learn a number of fundermental Data Modelling Patterns and DAX Patterns in Power Pivot that are useful for analytical and operational reporting. This demo-driven module will provide attendees with enough samples to build dynamic KPI’s, interactive last 12 months analysis, custom calendar, market basket analysis and churn analysis.
Power Query 101 (For Power BI Dashboard)
Power BI Dashboard Preview has just been introduced very late in 2014. We will take a walk through creating dashboards using Power BI Designer (Preview) and how to publish it to Power BI Dashboard (Preview) site. Using Power Query, we will retrieve corporate data and produce powerful dashboards.
Creating Interactive Visualisation for Actionable Analytics
In this session, attendees will learn how to produce actionable analytics from the design and visualisation principles. Using Live demo’s, we will apply these techniques to Power View and Pivot Table/Charts. We will also learn how to use Filters, Slicers and Time Intelligence to enhance Pivot Tables / Charts for analysis. We will also learn how to configure Power Pivot to enable Power BI Q&A to build interactive visualisation. In addition, we will learn how Power Map can serve geospatial analytics. Lastly, we will discuss how to configurethe forecasting / trend analysis feature in Power BI.
Tips and Tricks on Charts and Data Models
This module outlines how to choose the appropriate charts for specific purpose, and when it’s best to use Power View vs Pivot Table/Charts for dashboards and reports. It will also outline how to optimise the performance of Data Models, and provide alternatives to Power Pivot. We will look into when it is appropriate to upgrade to server based data model, such as Analysis Services Tabular Model and what other capabilities it can offer and restrictions that come with it.
Publishing and Administering Dashboards and Reports in Power BI for the Organisation
In this last module, attendees will learn how to publish the Power BI workbook within a team. We will also discuss how to configure schedule data refresh for Power Pivot, how to setup Data Management Gateway to access on-premise data and other settings that are available from the Power BI Admin Centre.


No responses yet