Earlier this month, I have presented “Power View for Geographical Analysis” as part of my Pacific Northwest US tour. My apologies for posting this fairly late in the month, following the presentations, as I have a few other commitments earlier this month.
Without further ado, below are the sample files:
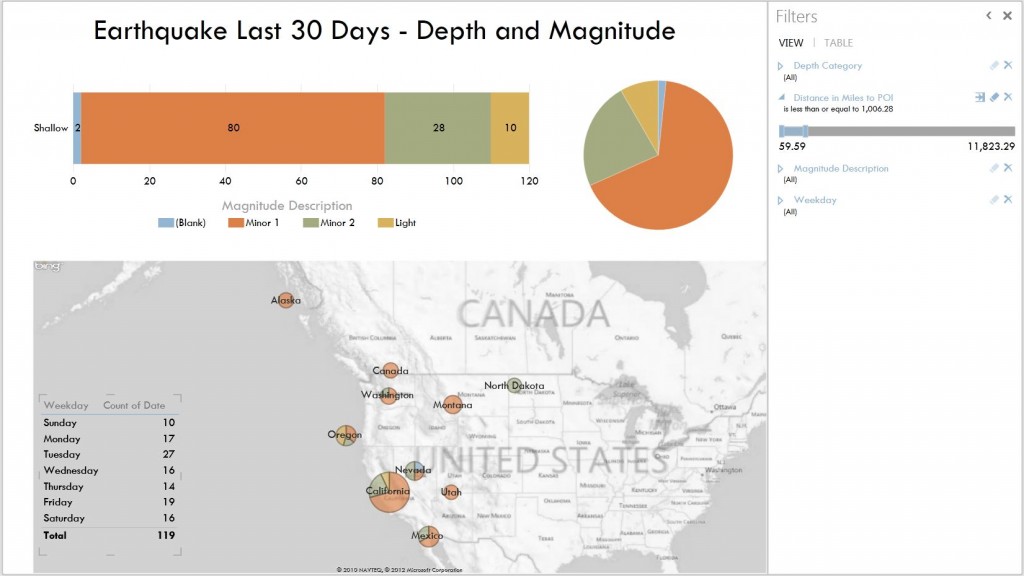
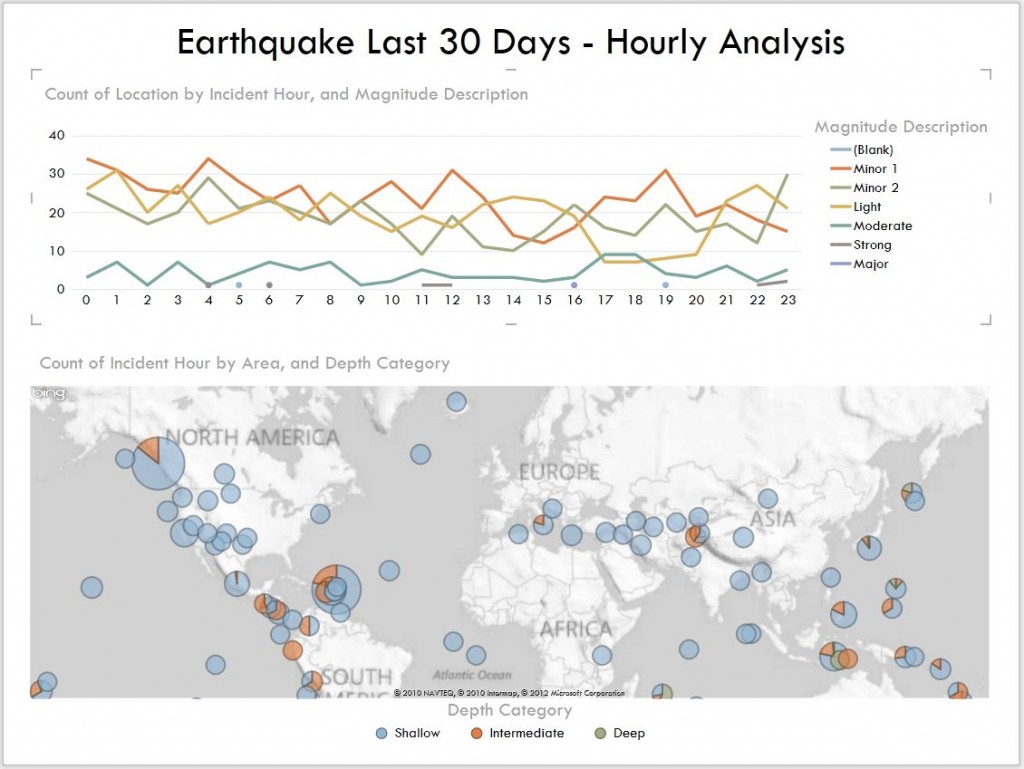
1. Earthquake Last 30 Days
The data is retrieved from the USGS website. This particular workbook was manually prepared (i.e. data copied and pasted from the webstite). The workbook has been cleansed and manipulated using Excel flash fill functionality and contains from 11 September 2012 to 11 October 2012.
The workbook does not retrieve the data from the USGS website automatically.
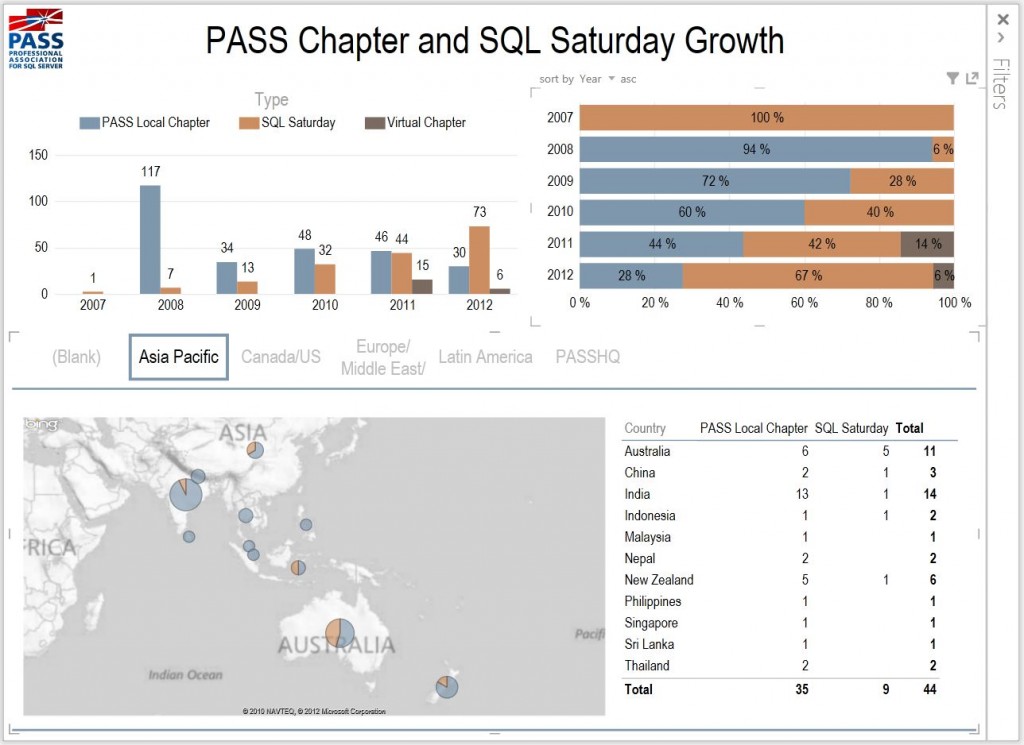
2. PASS Chapter and SQL Saturday Growth
Taking the data from 2 different sources, Dan English’s SQL Saturday workbook and Karla Lundrum’s report from PASS HQ, this demo shows how to combine them together.
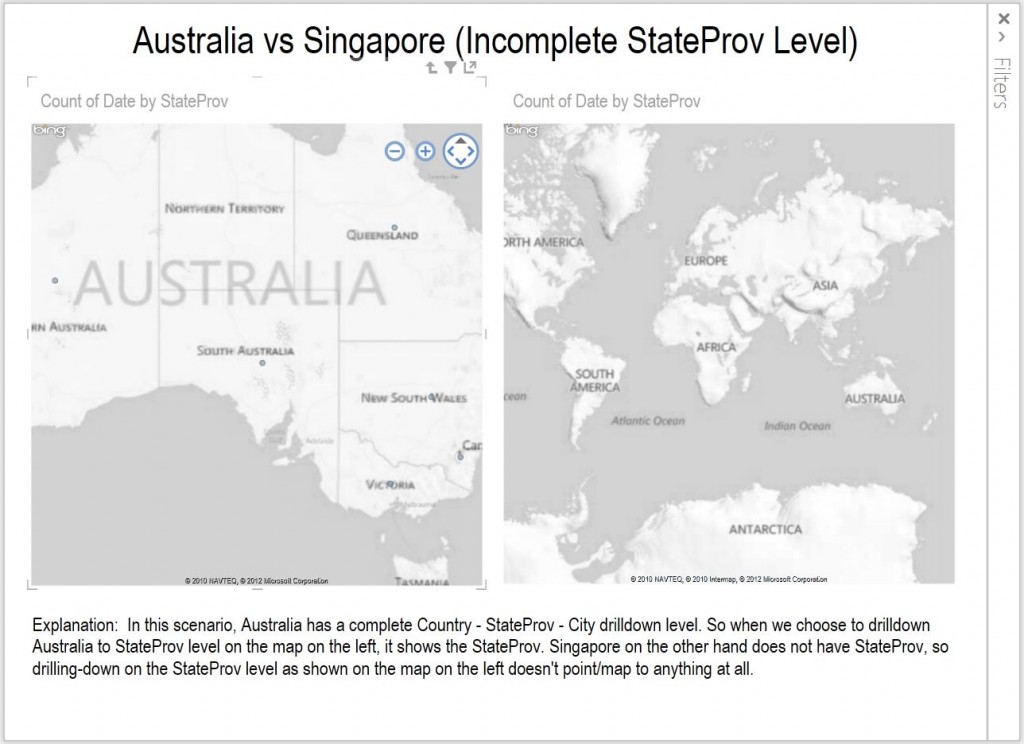
There is also a section here that shows implications of incomplete Location hierarchy. In this example, Australia has complete Country – StateProv – City definition, whereby Singapore is missing StateProv information.
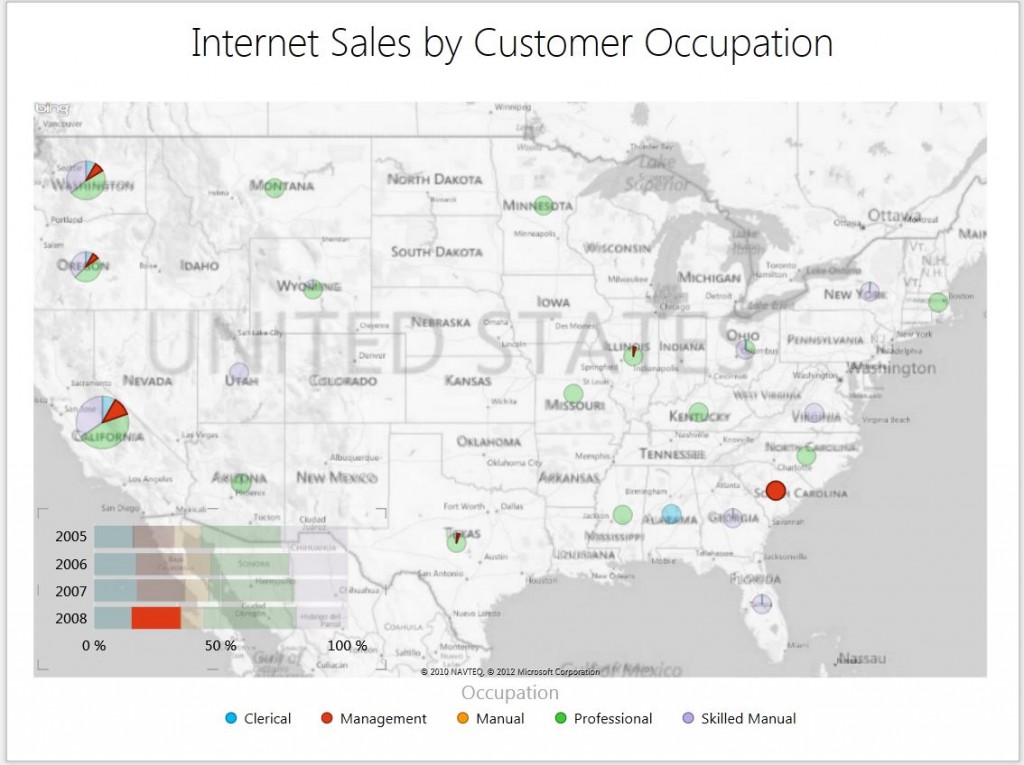
3. Internet Sales by Customer Occupation
A simple Adventure Works sample which shows well structured data model with good quality data. In this case we analyse Internet Sales by an attribute that doesn’t directly link to the sales, such as Customer Occupation.
Wrap up
These sample files contain static data – i.e they do not retrieve data from data sources auotomatically. Hence the data is as at the time of preparation. The aim of the sample files is to provide an overview of Geographical Analysis techniques using Power View in Excel 2013. As I have mentioned in my sessions, having good data model and data quality is important to build good interactive analysis using Power View. However, in real life, we may be far from a perfect data quality as shown in the Earthquake example and the PASS Growth example. However, with creativity we can generate something meaningful for analysis.
Hope you enjoy the sample files.
Note: the workbook should work with Office 2013 Preview, if it does not, please let me know.
My version of Excel 2013 is: Microsoft Excel 2013 (15.0.4420.1017) 64-bit; Part of Microsoft Office Professional Plus 2013.
5 Responses
Nice work. This is some good stuff.
Thank you! It is so good work:)
These look lovely. We’re evaluating PowerView and Tableau at work. Having lots of issues opening and running Power View 2013. At work and home. too bad.
Hi John,
Thanks for leaving feedback. Hope your evaluation of Power View is doing well. If you have specific feedback or discuss the positive and paint points of Power View and how it compares with Tableau, I’d love to hear from you.
Kind regards,
Julie
Thank you. Was great help.