Power BI team has been very busy the past month or so. There have been a few interesting posts around Power BI, some of which related to Power BI Contest (Congratulations to the top 5 winners!). Two blog posts that I find interesting in February 2014 around Power BI are:
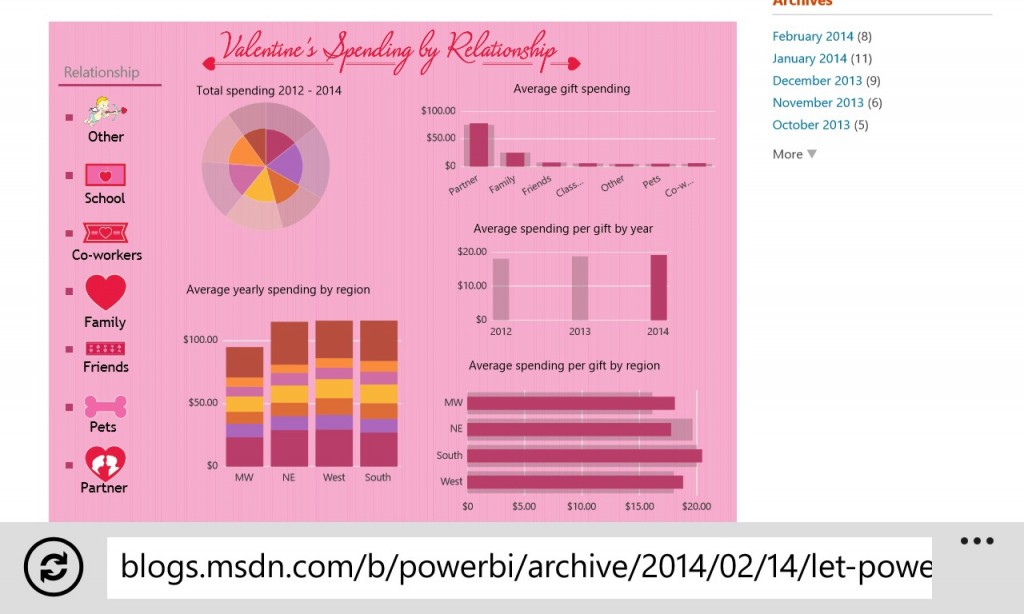
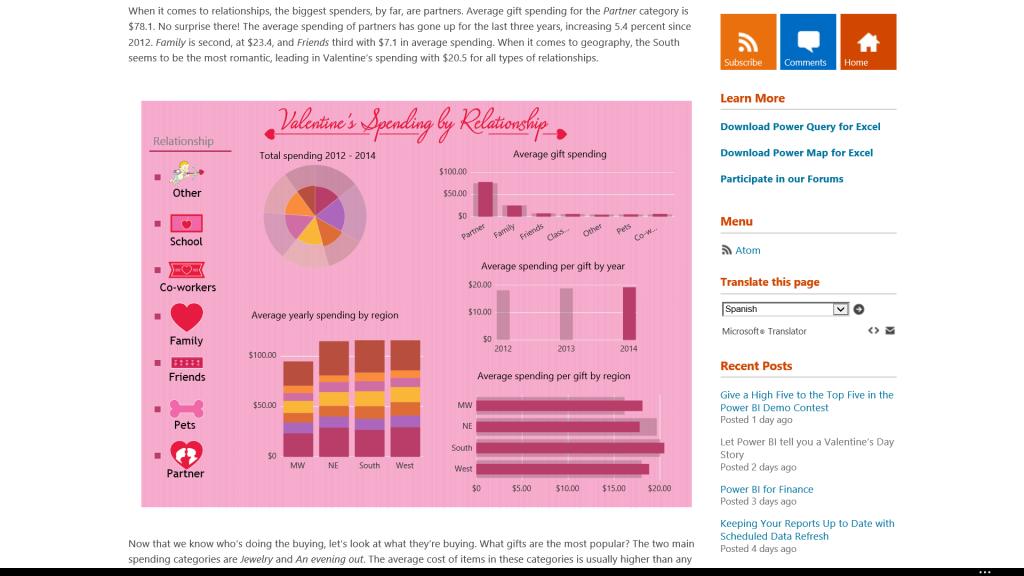
1. Let Power BI tell you a Valentine’s Day Story
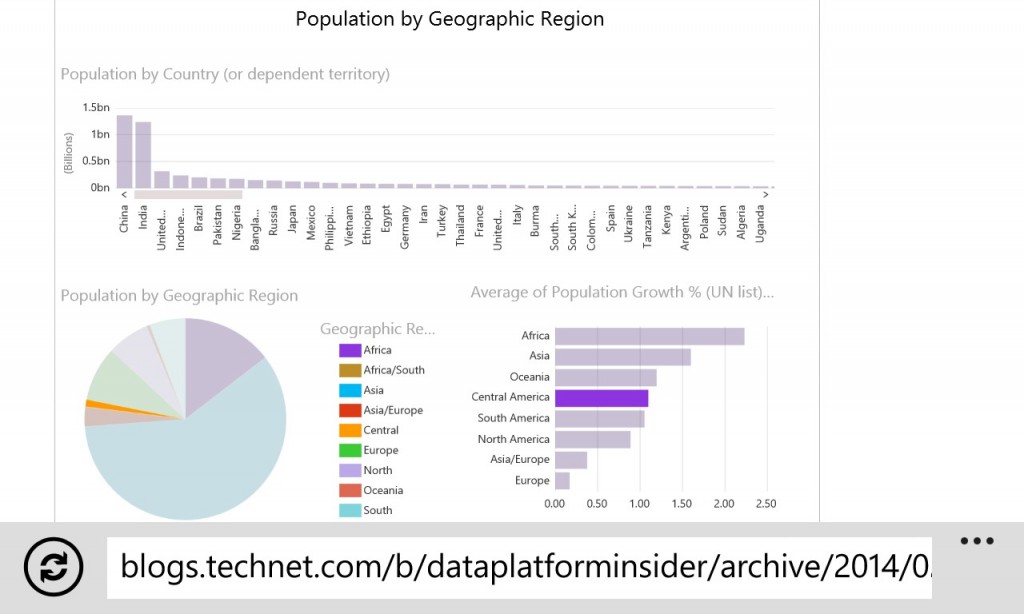
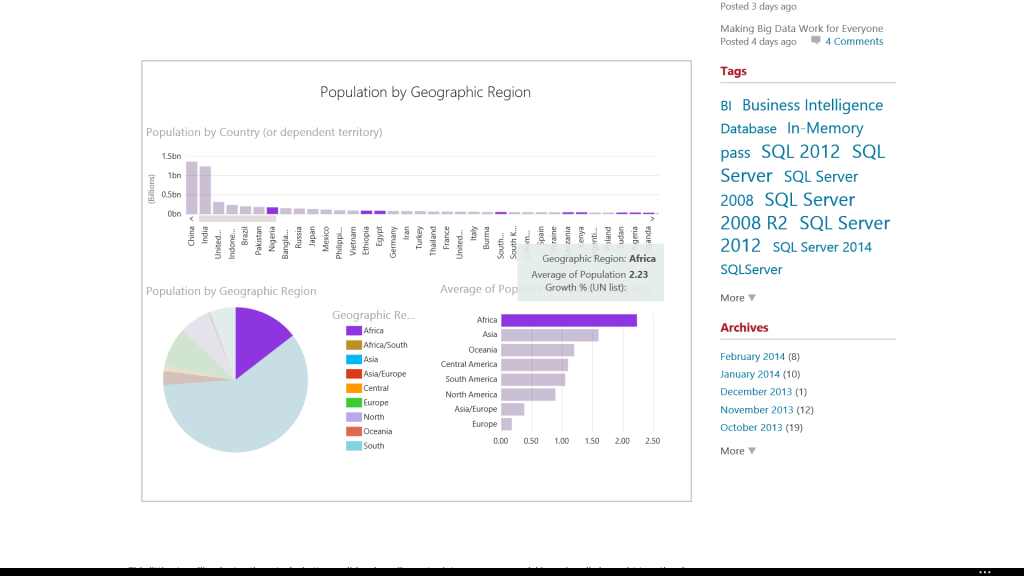
2. Making Big Data Work for Everyone by Quentin Clark
I find these posts interesting because you can interact with the Power View visualisations embedded on a website that is publicly accessible.
That’s it for the “in-a-jiffy” part. Read on for more details on how the embedded Power View visualisations perform on various devices.
Embedding Interactive Power View Visualisations – Early Samples
I was very excited about it when I first saw the two posts mentioned earlier. I have then decided to test them on a few different devices and asked help from friends / families to help testing out on their device of choice. Below are some screenshots taken from these devices along with a short review on each device.
1. Nokia 1020
The visualisations work well on Nokia 1020.
Note: Clicking on “Sort” to change the sort order can be a little tricky due to the size. Zoom pinch in/out on Power View frame is not recognised, instead it is being treated as “click” / “touch” action. The screen size is big enough to interact with it, but it’s not going to be as easy as with larger real estate.
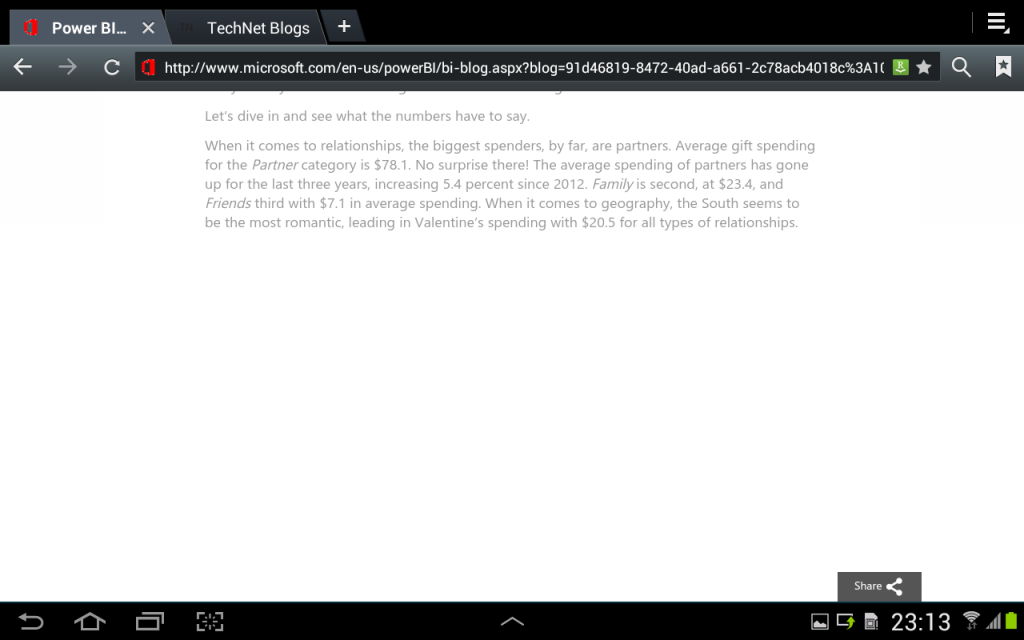
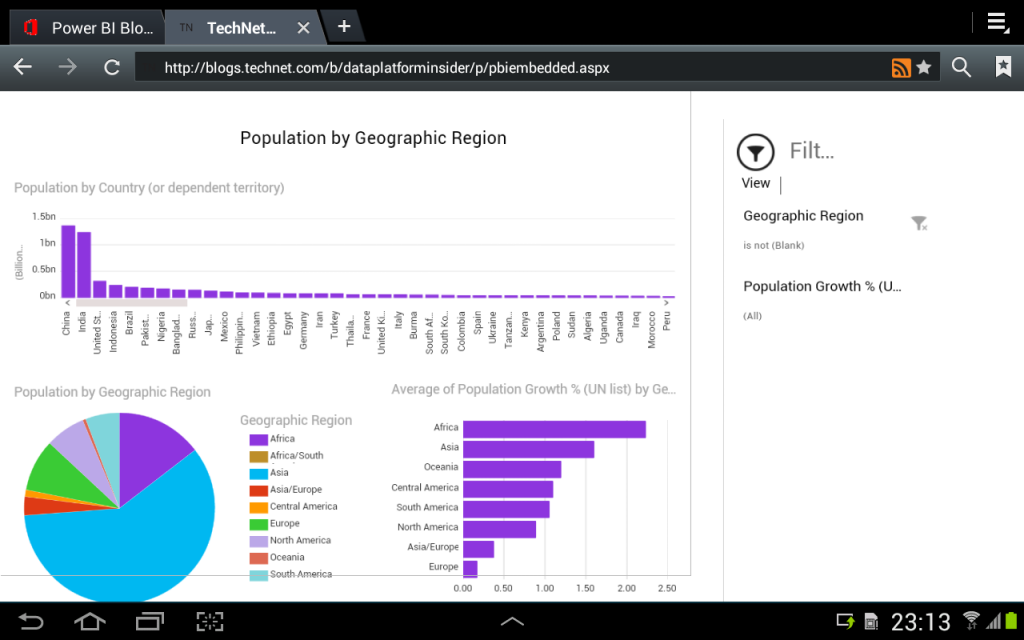
2. Samsung Galaxy Tab 7.7
It doesn’t work after a few attempts. When it is still loading, it looks like it is going to render OK, but then the Power View charts disappear.
Instead of showing another example of the Power View visualisation for the second article (Making Big Data Work for Everyone), below is a screen shot of the corresponding Power View on Excel Web App on Samsung Galaxy Tab 7.7, which works 50% of the time.
3. Surface 2
It works fabulously (as one would expect), better than on Nokia 1020.
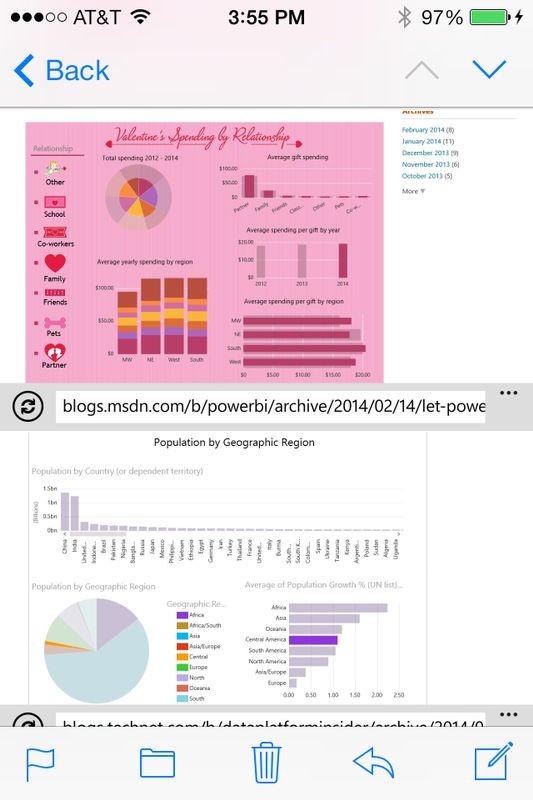
4. iPhone 4s
I’m happy to say that it works on iPhone 4s too!
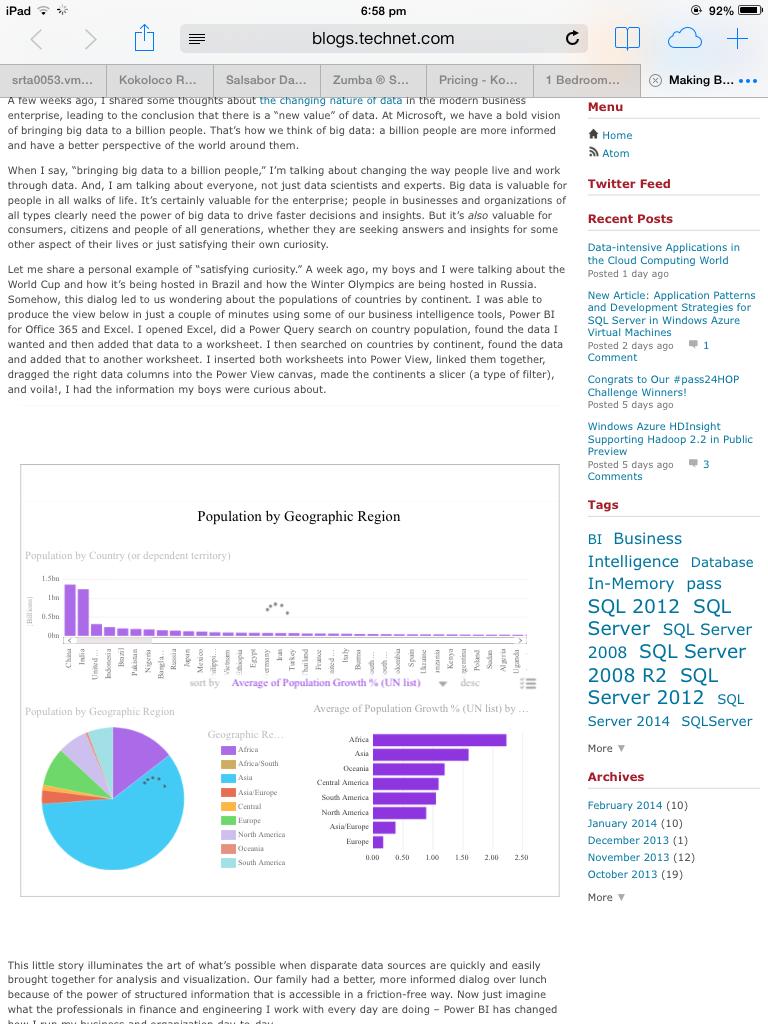
5. iPad Mini (iOS 7)
The first article crashes the browser. I have tried a few times unfortunately it yields the same result.
The second article seems to be loading OK, but not interactive. It looks like it would do the highlight filter when you touch on a bar chart column, however it resets back to normal as shown on the screenshot below.
Thank you to friends and families in lending their devices to me for testing this feature.
Whats The Big Deal?
From mobility point of view, it’s about time … 🙂 As you may know, other “pretty” data visualisation competitors out there have had embedding features for a whlie. Check out this Would you like extra germs with that? article on Sydney Morning Herald that embeds engaging data visualisations on Food Safety Offences.
A few caveats:
- Power View registers “mouse-hover” actions. On touch-screen devices, it is almost nearly impossible to emulate the “mouse-hover” actions.
- Pinch actions for zooming in and out on the Power View frame is not smooth and may not work to zoom in/out properly.
Wanna Help?
If you’d like to help, please comment below and send me screenshots of the Power View Visualisation from the two sites mentioned earlier, using devices that are not listed here yet. You may want to try some “pinch” and “touch” actions on the Power View frame, and let me know if interaction with the chart works (for example, filtering/highlights). Thank you in advance.
You can also tweet me @MsSQLGirl and attach the screenshots with #PowerView hashtag.
Wrap Up
Two recent blog posts from Microsoft exhibit ability to embed Power View visualisations. The next question is, how is it done? Stay tuned!
Further Reading
Power BI For Office 365 – Microsoft
Power View: Explore, Visualize And Present Your Data – Microsoft
No responses yet