Thank you for those who attended my “From Impaired to Insightful Geospatial Reporting” session at beautiful Orange County SQL Saturday 201. We started early at 8:30AM on April 20, 2013 which did not deter a lot of you to come in and learn more about Geospatial Reporting.
Below are brief details on my session:
From Impaired to Insightful Geospatial Reporting
Abstract
It is expected that business reports be insightful and engaging. Region based reporting can be transformed from boring grids to visually interactive maps. This session will describe how to embark upon self-service and mobile BI solutions that are available within the Microsoft BI stack for analytical geospatial reporting. You will learn the basics of geographical data, including GIS, Longitude-Latitude coordinates and free form text. Using these different data types, we will discuss SSRS 2012, Power View and Excel 2013 tools that can leverage insightful analysis. Finally and most importantly, attending this talk will get you started in learning the essential techniques to deliver geospatial reports that tell meaningful stories for users.

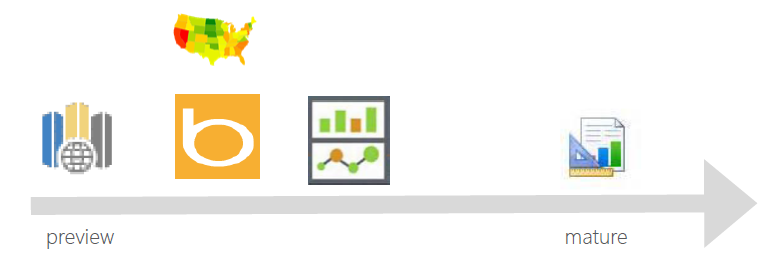
From left to right: GeoFlow Public Preview for Excel 2013, Geographic Heat Map app for Excel 2013, Bing Map app for Excel 2013, Power View and SSRS.
Feel free to leave comments. This session is a brief summary of my view of the Geospatial reporting tools that are available on Microsoft platform.
Slide decks for other SQL Saturday 201 sessions can be downloaded here: http://www.sqlsaturday.com/201/schedule.aspx. The sessions marked with asterisk (*) on the schedule are those with downloadable materials.
No responses yet