I recently had an assignment to build a prototype for one of my clients, which involved in setting up KPIs. I then had a talk with a couple of people in my network to discuss how one could setup dynamic KPI thresholds. Narius Patel came up with a great idea of representing KPI status with image and using separate table to store the threshold values. (Thanks Narius!) So, here’s my attempt of implementing it.
In this article, we will walk through some customisations that you can do on Power Pivot data model to enable Dynamic KPI Threshold. The same technique applies to Tabular Model. For simplicity of sharing the source files, I have implemented this in Power Pivot. If you would like the Tabular version, please let me know 🙂
The Existing KPI Feature In Power Pivot
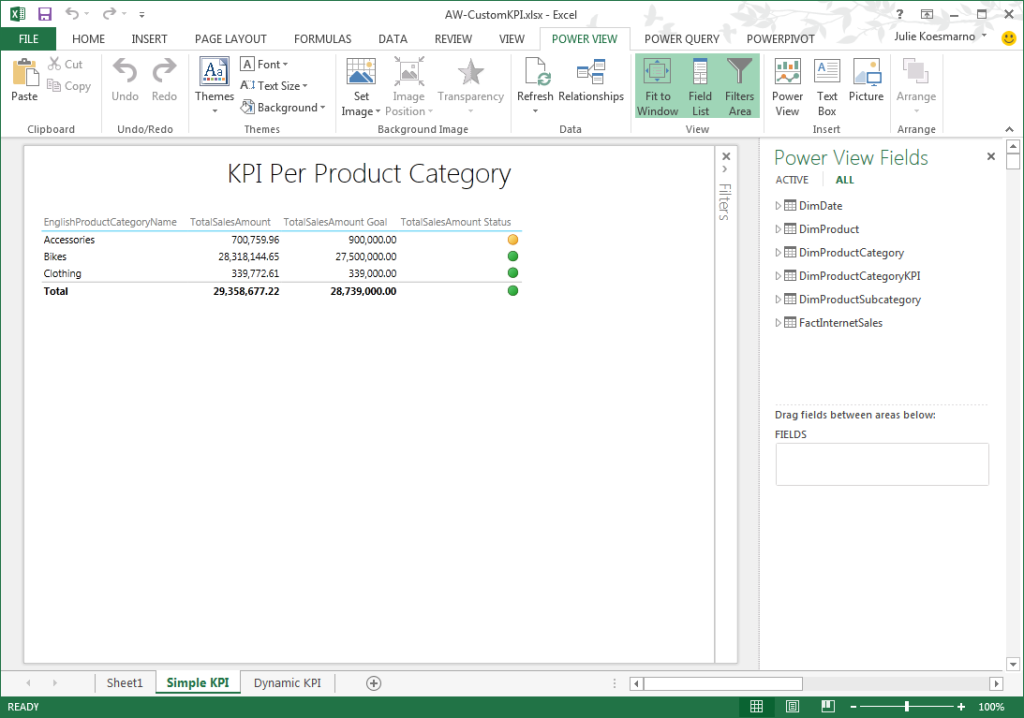
In case you are not aware, one of the nice features that is available from Power Pivot is the ability to setup KPI that can be shown on Power View, as you can see below.
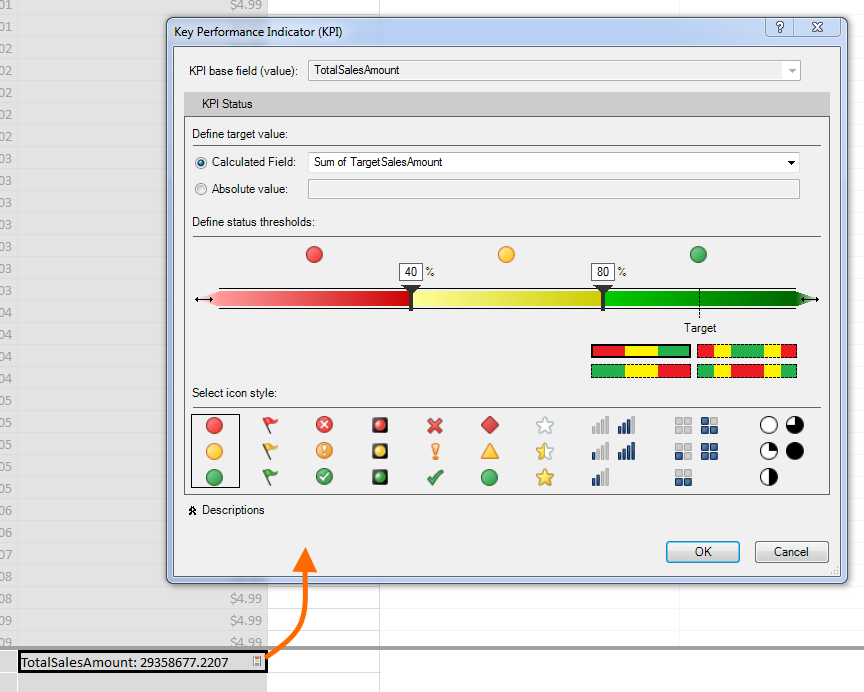
In Power Pivot, you can add KPI to a Measure and configure it just like this:
Limitations Of The Existing KPI Feature
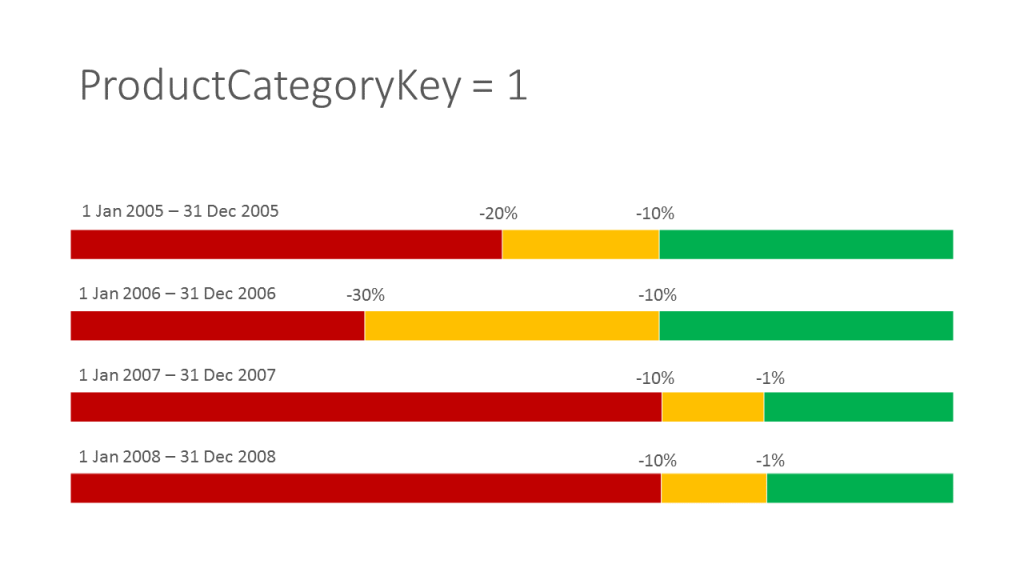
Power Pivot / Tabular KPI currently does not support dynamic KPI Threshold configuration. For example, if you have a requirement such that one Product Category would have different Threshold values (e.g. for the Green, Yellow, Red traffic lights) for different period of time as represented by the image below, the standard KPI setting that Power Pivot / Tabular offers would not be able to solve this issue.
The Purpose
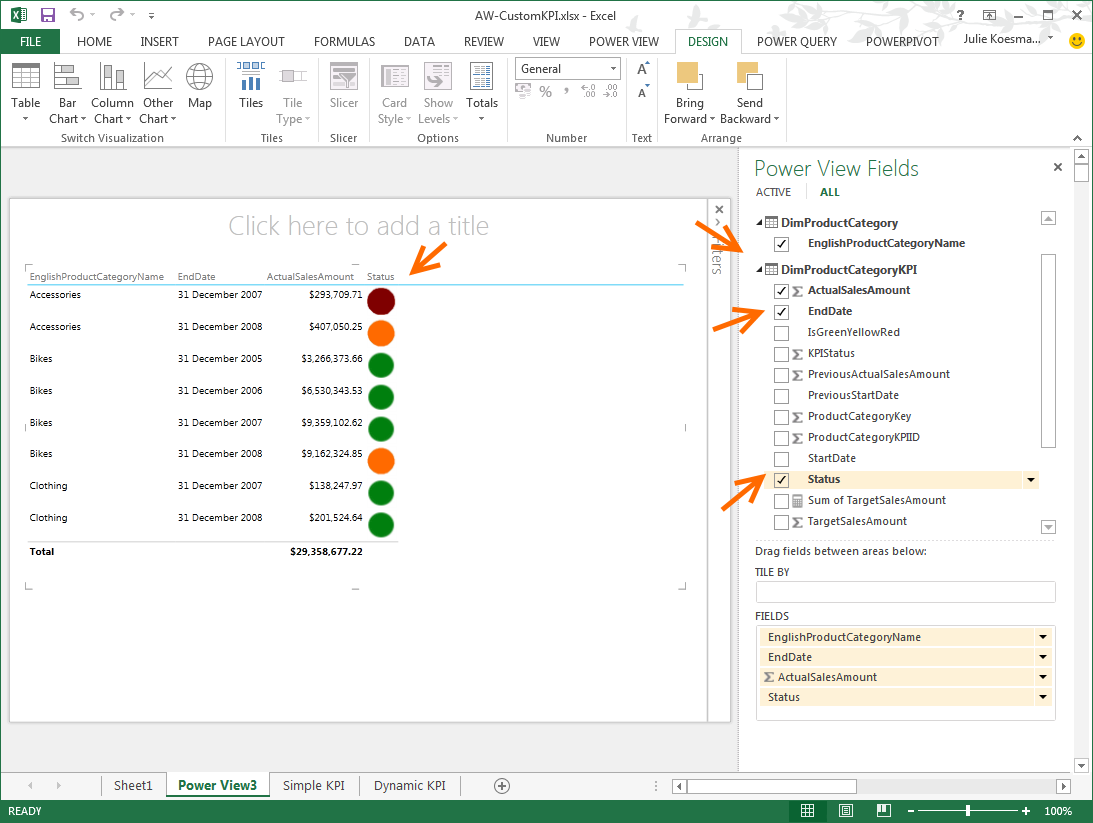
Our goal is to create a Status column on Power View that indicates the KPI Status as per Product Category, Year and its threshold per year, as illustrated below: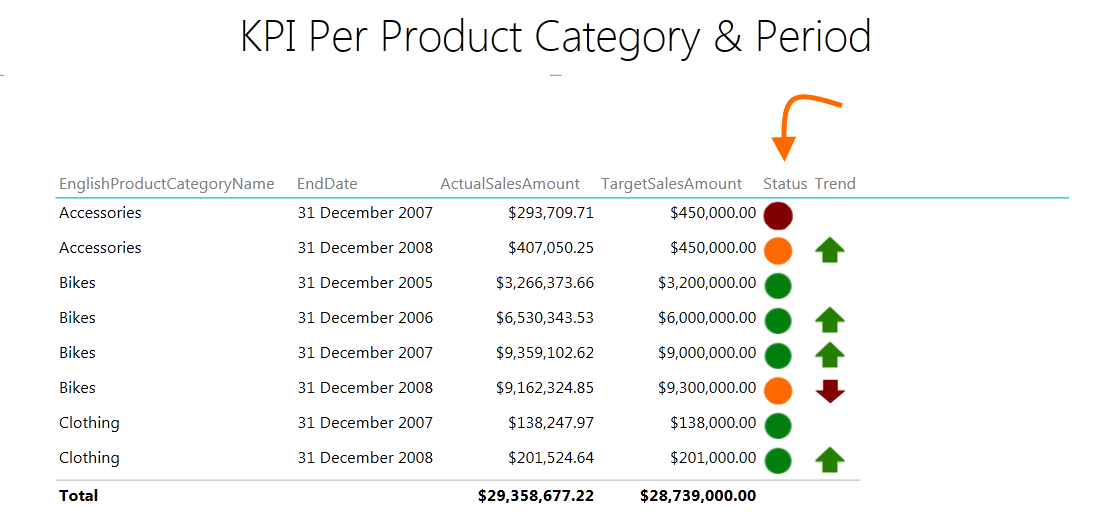
In this blog post, I will provide a workaround for this using Image and some simple table configurations.
Prerequisites
- AdventureWorksDW2008R2 (minimum) installed on your server.
- KPI Configuration Table to store the upper and lower Yellow values for each Product Category, and for a defined set of periods. Use the AW-DimProductCategoryKPI.sql table creation script as a sample.
- KPI image reference table. This table contains the traffic light images. Use the AW-DimKPIImage.sql table creation script here as a sample.
KPI Configuration Table
In this example, I’m referring the table as DimProductCategoryKPI where it contains the following columns. You can adapt this table to suit your needs.
| Column Name | Description | Sample Value | Explanation |
|---|---|---|---|
| ProductCategoryKPIID | Sequential ID / Primary Key | 1 | Primary Key |
| ProductCategoryKey | This refers to the Product Category for the KPI setting | 1 | Foreign Key referring to Product Category Key 1 |
| StartDate | This refers to the start date of when the KPI setting is valid | 1 Jan 2005 | |
| End Date | This refers to the end date of when the KPI setting is valid | 31 Dec 2005 | |
| IsGreenYellowRed | A Boolean column dictating if the direction of the traffic light is Green Yellow Red (i.e. Smaller is Green and as the number increases it becomes Yellow and Red) | 0 | This represents False for the opposite direction |
| YellowStart | The value of the start of Yellow | -0.2 | This represents -20% of the expected Target value |
| Yellow End | The value of the end of Yellow | -0.1 | This represents -10% of the expected Target value |
| TargetSalesAmount | The target expected value. In this instance, it's referring to the target sales amount of the product category | 3200000 | Target value is $3,200,000 for the 1 Jan 2005 and 31 Dec 2005. |
KPI Image Reference Table
This is a simple table referring to where the image URL should be retrieved from, and should ideally contain the following columns.
| Column Name | Description | Sample Value | Explanation |
|---|---|---|---|
| KPIImageID | Sequential ID / Primary Key | 1 | Primary Key |
| KpiType | A column representing the type of KPI image. In this example, I have two possible types which are Traffic or Trend | Traffic | This is a "Traffic" light type of KPI image. |
| KpiName | A column representing the KPI image name | Green | This represents a Green traffic light circle |
| ImageURL | The URL where the KPI image is stored | https://www.mssqlgirl.com/wp-content/uploads/2014/11/KPIGreen.png | The link to the Green traffic light circle. |
Assembly Time!
Once all the categories are all setup, you can start developing a Power Pivot workbook with the following tables imported:
- FactInternetSales
- DimDate
- DimProduct
- DimProductSubcategory
- DimProductCategory
- DimProductCategoryKPI
- DimKPIImage
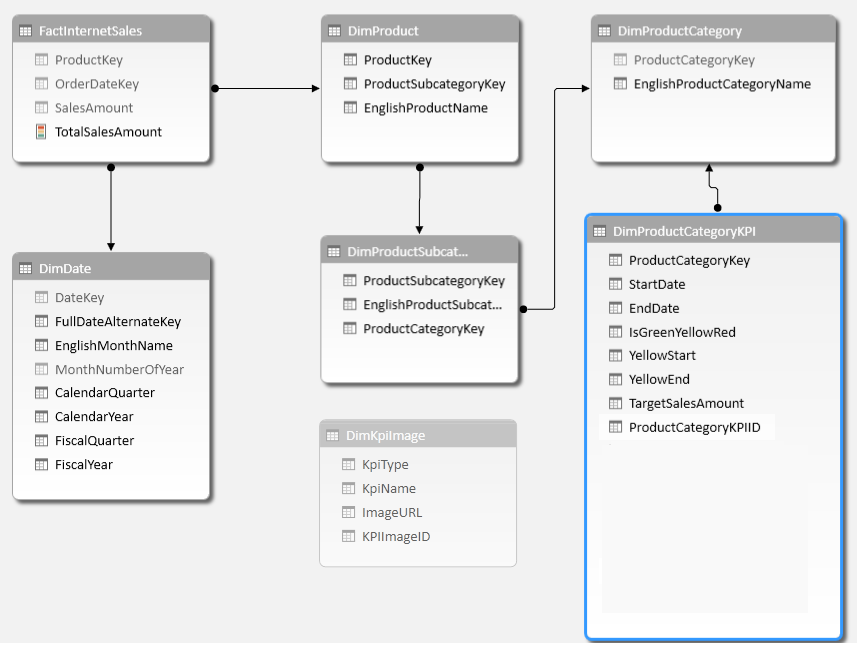
After you import the tables, the Power Pivot diagram view will look similar to the following. Please ensure that the relationships are setup properly.
From here, we will add a number of calculated columns to DimProductCategoryKPI. The aim is for this table in Power Pivot to contain not only the target Sales Amount value and KPI configuration, but also the actual Sales value and the KPI status. (As a bonus, I have also added a set of calculated columns relating to Trend, to be discussed in an upcoming blog post). Let’s go through the calculated columns for displaying traffic Status one by one.
The Bits For Status
There are 3 steps to add Status to the Power Pivot model.
Step 1 – Add Calculated Columns Related To Status
Below are a list of calculated columns that you need to create to display the Status image, i.e.
Actual Sales Amount
This calculation looks up the SalesAmount value from FactInternetSales given the row context of the ProductCategoryKey.
=
CALCULATE (
SUM ( FactInternetSales[SalesAmount] ),
FILTER (
FactInternetSales,
RELATED ( DimDate[FullDateAlternateKey] ) >= [StartDate]
&& RELATED ( DimDate[FullDateAlternateKey] ) <= [EndDate]
&& RELATED ( DimProductSubcategory[ProductCategoryKey] )
= EARLIER ( [ProductCategoryKey] )
)
)
KPI Status
This column is determined by the variance of ActualSalesAmount to the TargetSalesAmount, with respect to the TargetSalesAmount value.
=
( [ActualSalesAmount] – [TargetSalesAmount] )
/ [TargetSalesAmount]
Status
This column looks up the Image URL appropriate to the KPIStatus for the row context. It inspects IsGreenYellowRed, KPIStatus and YellowStart to get the KPIImage value.
=
IF (
NOT ( [IsGreenYellowRed] ),
IF (
[KPIStatus] < [YellowStart],
LOOKUPVALUE (
DimKpiImage[ImageURL],
DimKpiImage[KpiName], “Red”,
DimKPIImage[KPIType], “Traffic”
),
IF (
[KPIStatus] > [YellowEnd],
LOOKUPVALUE (
DimKpiImage[ImageURL],
DimKpiImage[KpiName], “Green”,
DimKPIImage[KPIType], “Traffic”
),
LOOKUPVALUE (
DimKpiImage[ImageURL],
DimKpiImage[KpiName], “Yellow”,
DimKPIImage[KPIType], “Traffic”
)
)
),
IF (
[KPIStatus] < [YellowStart],
LOOKUPVALUE (
DimKpiImage[ImageURL],
DimKpiImage[KpiName], “Green”,
DimKPIImage[KPIType], “Traffic”
),
IF (
[KPIStatus] > [YellowEnd],
LOOKUPVALUE (
DimKpiImage[ImageURL],
DimKpiImage[KpiName], “Red”,
DimKPIImage[KPIType], “Traffic”
),
LOOKUPVALUE (
DimKpiImage[ImageURL],
DimKpiImage[KpiName], “Yellow”,
DimKPIImage[KPIType], “Traffic”
)
)
)
)
Step 2 – Ensure Image URL Data Category Is Set
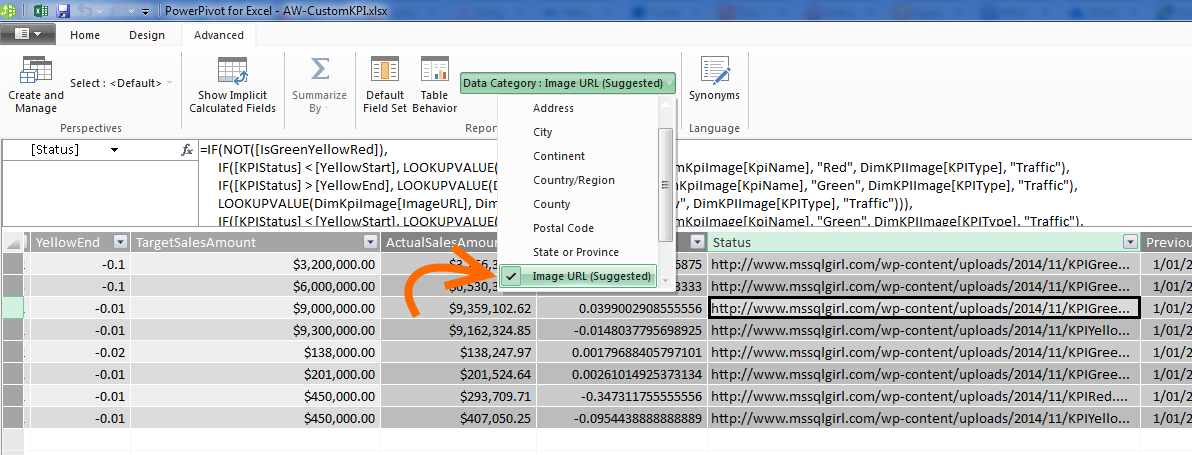
Once you have added the Status column, you need to ensure that you mark the column as an Image URL. Power Pivot should automatically detect it as Image URL. In case it doesn’t, go to Advanced > Data Category and select “Image URL” as shown below.
Step 3 – Create New Power View Sheet
Create a new Power View sheet and add the relevant columns to the canvas, including one of the Product Category columns, Start / End Date columns of DimProductCategoryKPI and the Status column of DimProductCategoryKPI. One of the reasons why you would want to include either Start or End Date (or both) is because DimProductCategoryKPI configures the threshold settings for each Product Category per defined period.
The working Power Pivot file along with the prerequisite files is downloadable here.
Wrap Up
Using calculated columns and a LOOKUPVALUE function, you can easily configure your own KPI setting. This blog post only covers how to configure Status for Dynamic KPI Threshold in Tabular or Power Pivot for Power View. Stay tuned on how to configure the Trend column for Power View, to complement KPI Status.
Special Thanks To …
DAX Formatter for beautifying the DAX code snippets above.

SSMS Tools Pack for making life easier in generating the CRUD statements for the Prerequisite files.


8 Responses
Hi Julie,
This was described nicely. One thing that I kept wondering though, is why you need the threshold to be dynamic. In this example, doesn’t that just mean that the targets should be adjusted during those periods? I’m sure there are scenarios where you’d want dynamic thresholds though.
Hi Greg,
The threshold percentages actually change in this scenario (so both targets and thresholds change for different periods). I have a real use case study in my recent client where the threshold changes per year and per category (e.g. Product Category).
Thank you for reviewing this post 🙂
Julie
Hi julie,
Can you please send me a link for Dynamic KPI Threshold in Tabular SSAS version as i need to implement something similar.
Hi Diptesh,
You can download the Excel file on the blog post and import it into SSDT as a new Analysis Services Tabular project.
Just in case you are have difficulties with it, I managed to squeeze in some time to pre-create it for you here. The project was created using SSDT VS 2012 for SQL Server 2012.
Hope this helps.
Julie
Thank you for the nice post,
But do we really want the image URLs? wouldn’t it give the same results if we created new KPI. lets say with (0, .5, 1) values, and make the target fixed number and fixed scale (1 is green, .5 is yellow and 0 is red) and the actual value is a calculated measure based on your model, but instead of saying yellow we say .5, 1 instead of green and the same for 0 and red?
Hi Saleh,
Thank you for the question – it’s an excellent one.
The blog post addresses the situation where there is a requirement for dynamic configuration on the threshold of the KPI colour (green, yellow and red; or the opposite) for 2 (or more) different variables, e.g. year and product categories. The blog post also suggests that by using a configuration table (e.g. dbo.DimProductCategoryKPI), the user can easily add / update / delete the threshold configuration for year, product category and the threshold values.
What you are describing is where there threshold are fixed; always exactly the same; or else, you would need to create a new measure for every different combination of year and product category.
Hope this helps.
Julie
Hi Julie,
can you please share a link for Dynamic KPI Threshold in Tabular model and Sharepoint poverview .
Hi Diptesh,
Unfortunately I don’t have a Tabular model version handy. You can however use the Power Pivot workbook as provided in the blog post and upgrade it to Tabular Model.
Hope this helps.
Julie