#SQLCoop team has the opportunity to collaborate together on one more topic, SQL Sentry Plan Explorer, before the year 2014 ends. This is great, because performance tuning is not something that I do too often these days. So, here are a couple of ways that I have used SQL Sentry Plan Explorer PRO.
Please visit SQL Sentry Plan Explorer for more information differences between the Free and the PRO editions.
Use Case 1: Saved Estimated Execution Plan
Recently I came across a requirement for writing reasonably complex queries (but similar) which took a long time (over 10 minutes to return a mere 18,000 rows each query). As I did not have SHOWPLAN access, the only Execution Plans provided to me from the DBA were just the Estimated ones. They were good enough for my scenario (read more on Comparing Estimated and Actual Executed Plans in SQL Server by Jes Borland). From here, I can simply open the Execution Plan file(s) sent to me in SQL Sentry Plan Explorer and it will show me the information captured. Also, due to confidential and privacy issue, I am not supposed to post the Execution Plans here. However, luckily SQL Sentry Plan Explorer can help with sanitising the real name of the objects mentioned by the Execution Plan.
Using the Anonymize button, you can sanitise the real name of the objects contained in Execution Plan.
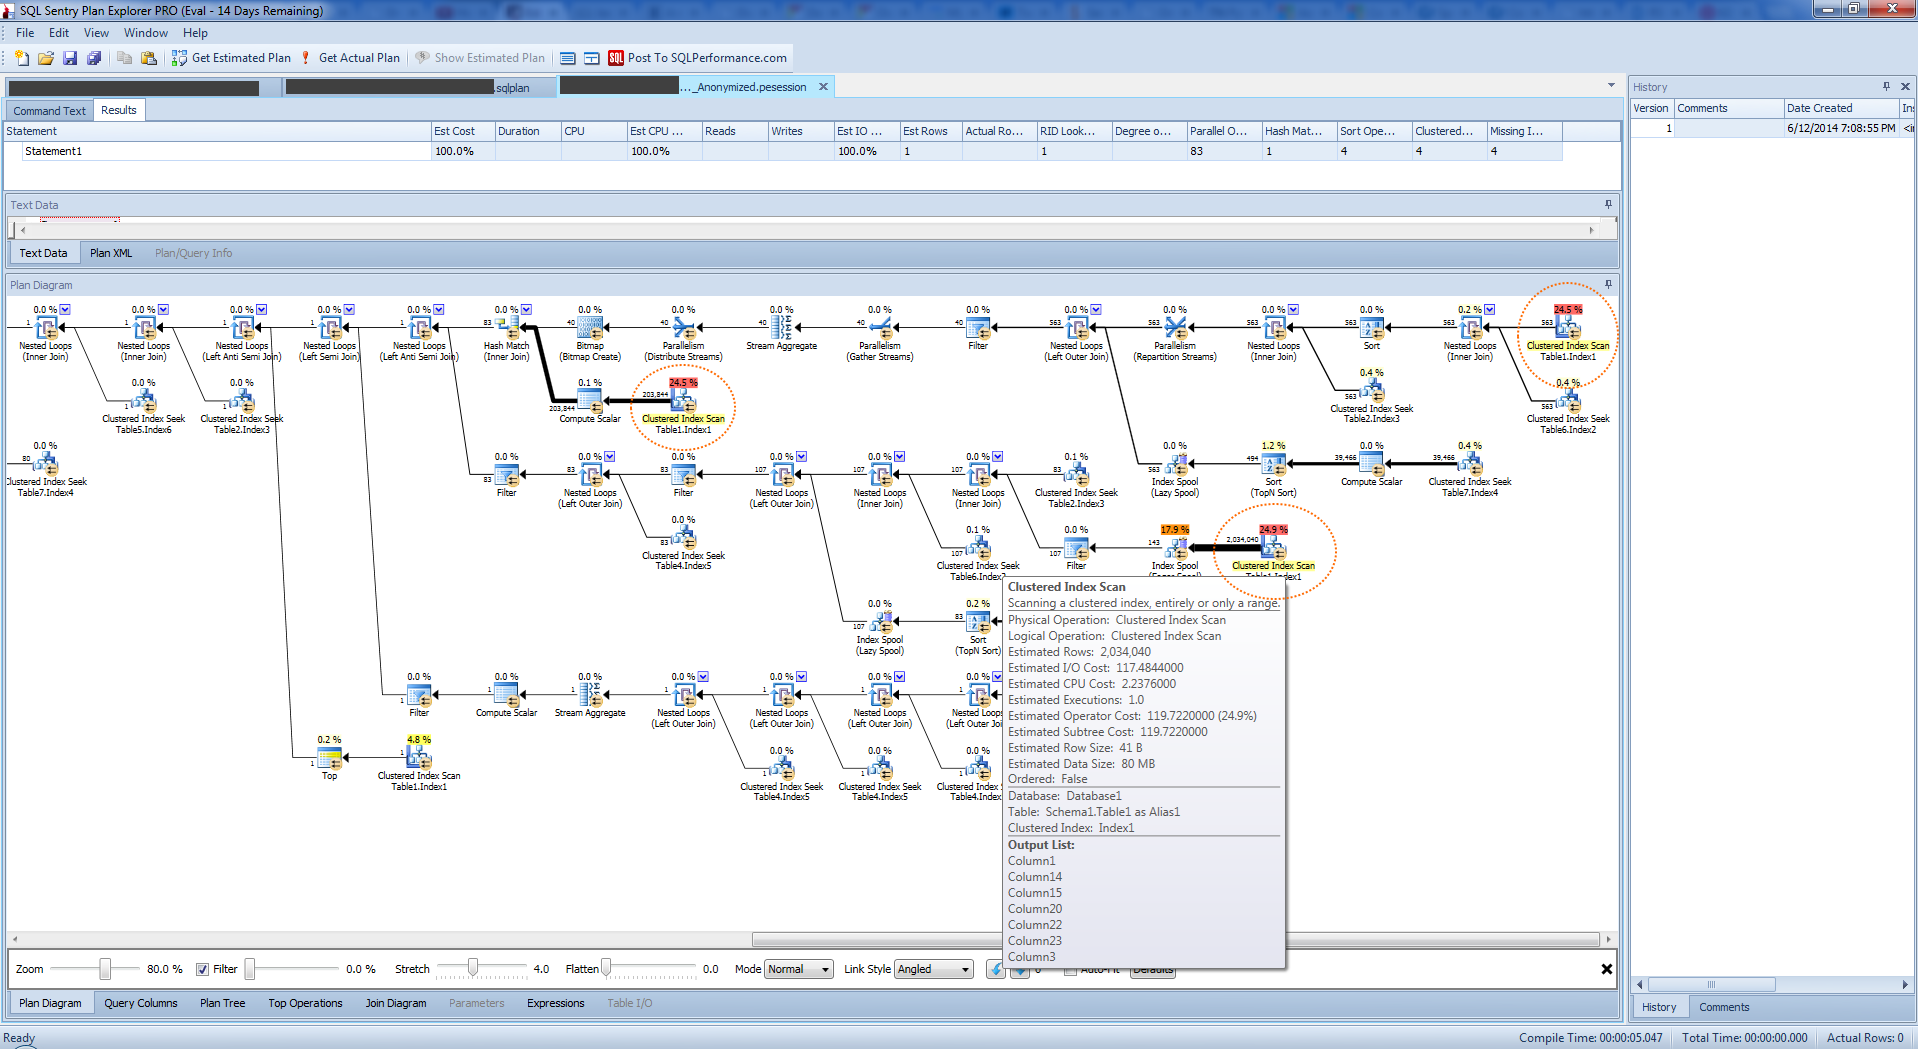
 The sanitised Execution Plan looks something like this.
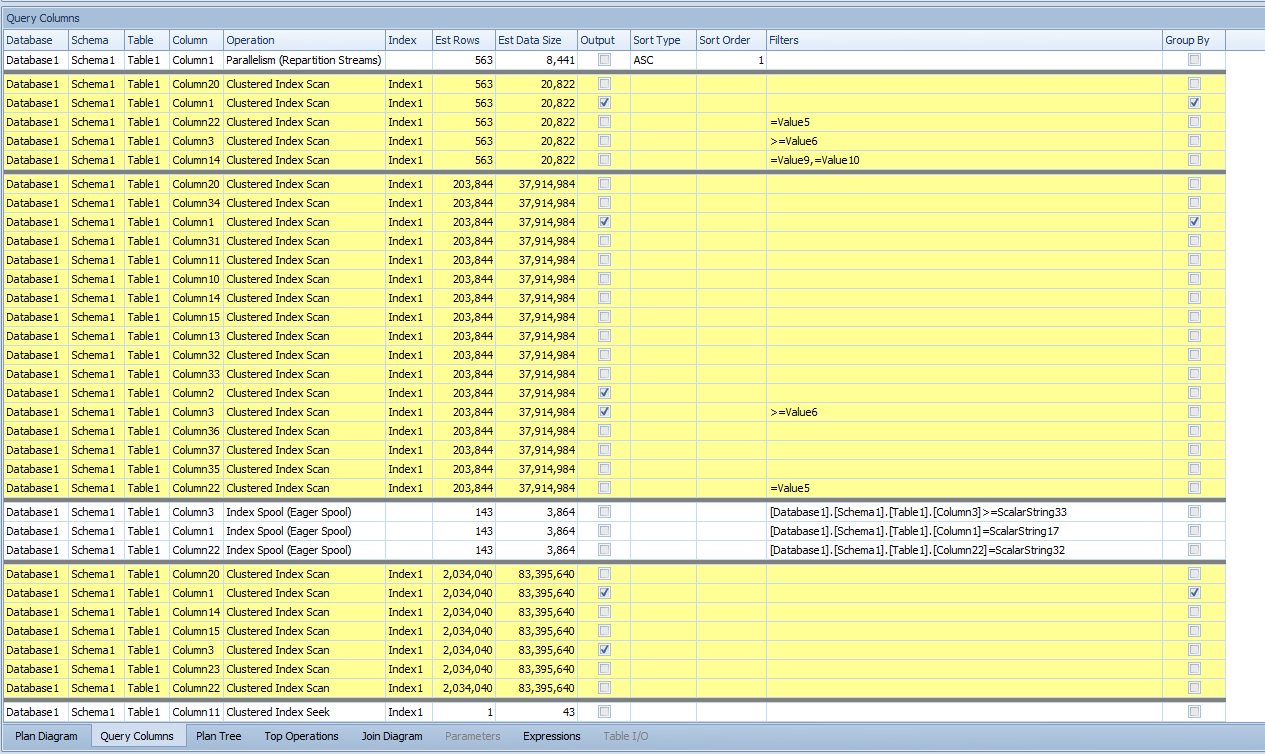
  If we take a look at this quickly, using the Plan Diagram tab, we can easily see that the Clustered Index Scan on Table1.Index1 are used three times with 24.5%, 24.5% and 24.9% of the CPU Cost + IO of the Execution Plan. In fact, if I switch to Query Columns tab, I could see in greater details of how the Clustered Index Scan was used.
  From here, I could see what a new index I could potentially create and do more tuning on. So, essentially, I can make a better educated guess (or more) on how to optimise the queries and create the appropriate index(es) for the slow running queries for this instance.
Use Case 2: Get Actual Execution Plan
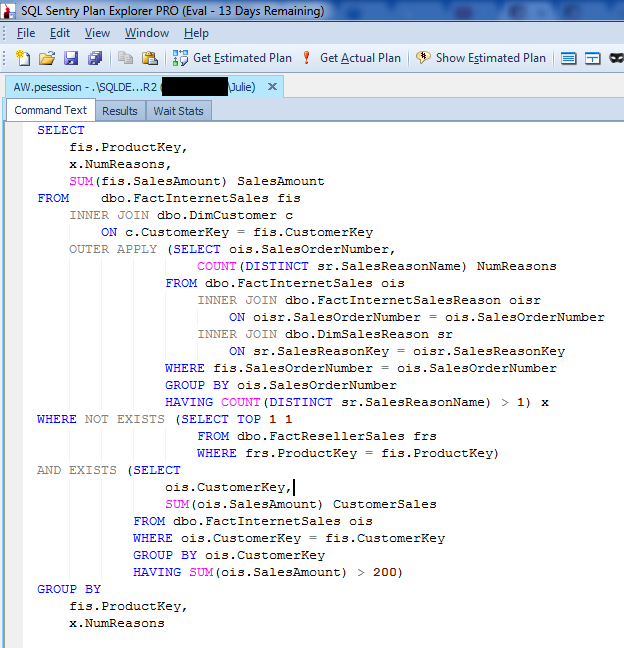
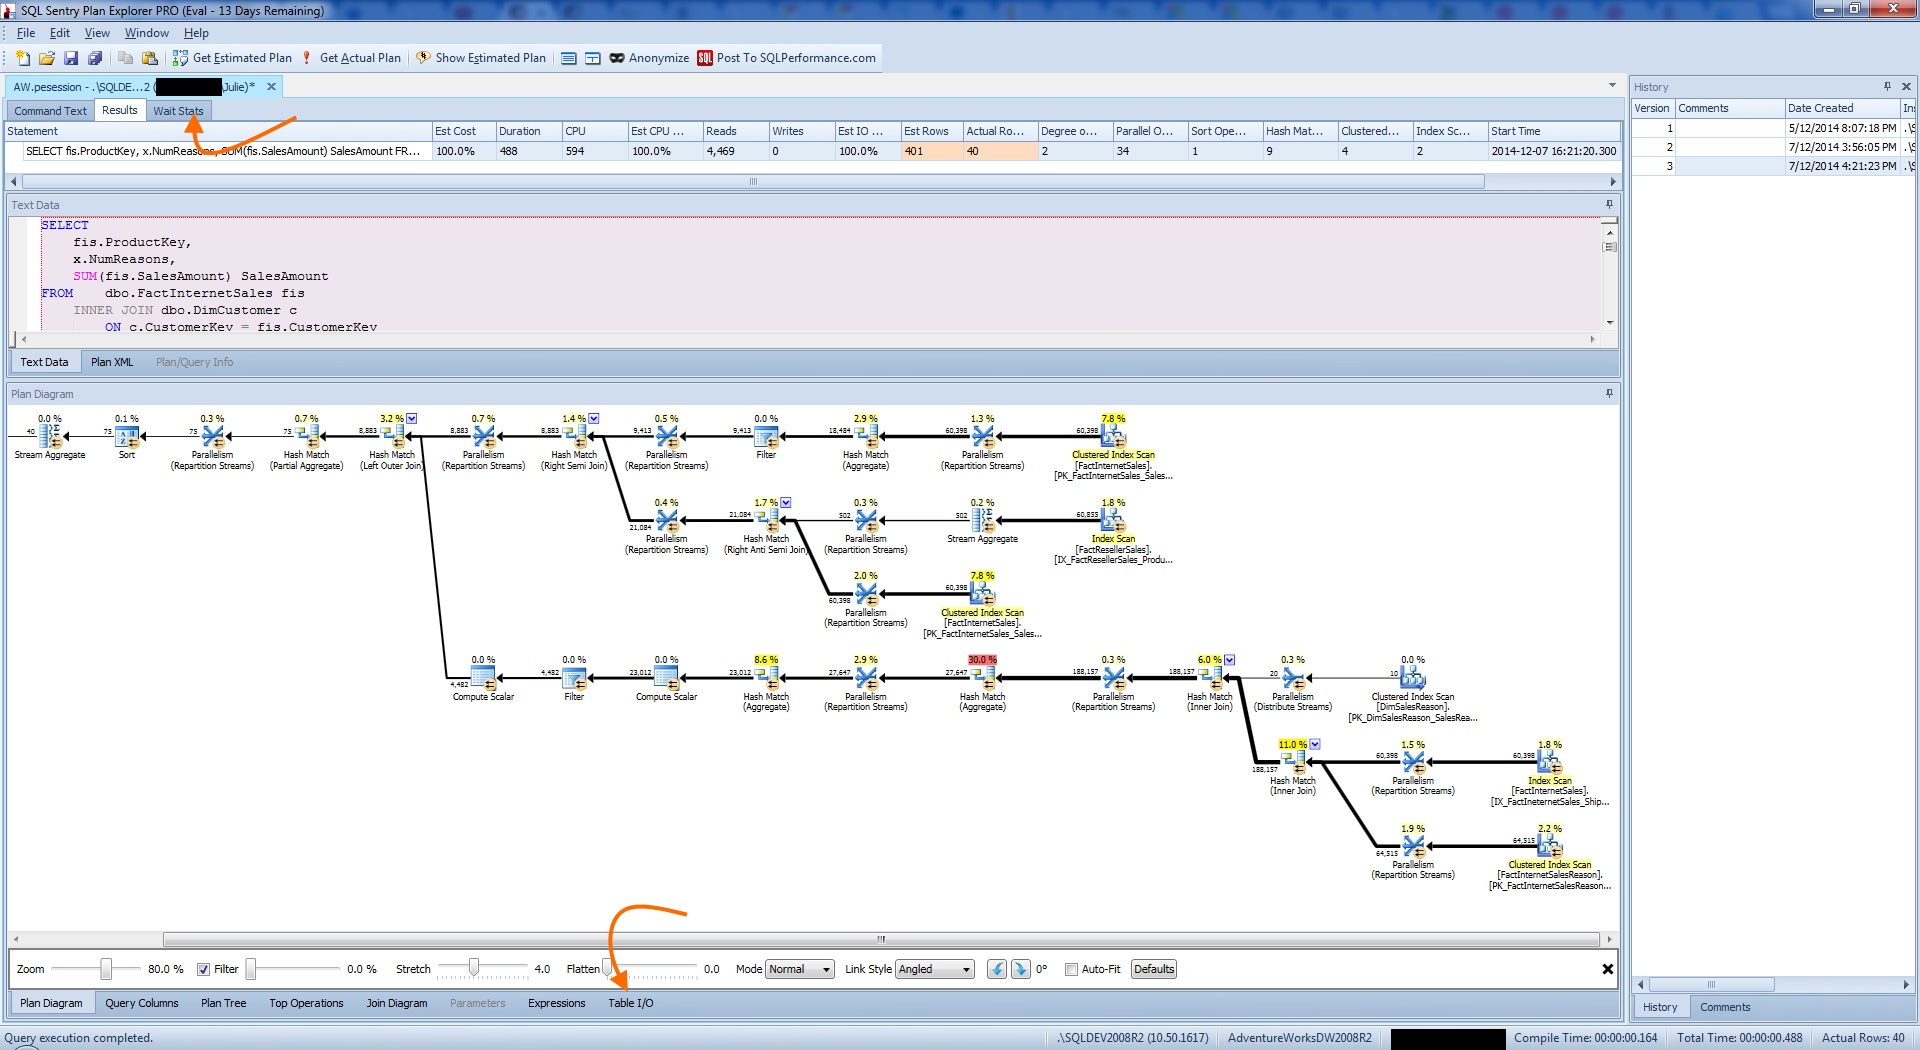
Another useful scenario is – if I have SHOWPLAN access – to run a query on SQL Sentry Plan Explrorer as shown below.  The result of running Get Actual Plan of this command text will show something like this:
  When running Get Actual Plan, you will notice that there are a few more views as marked by the arrows:
- On the top, there is Wait Stats next to Results.
- On the bottom, there is Table I/O.
This is expected because – to quote Jes’ article,
(With the Actual Execution Plan), SQL Server can tell you exactly how many reads were performed, how many rows were read, and what joins were performed.
Now, I have nicely organised and visualised rich information in SQL Sentry Plan Explorer to help with my investigation on optimising this query further. It does take less than 1 second on my laptop, so it’s not so bad. But it’s still an interesting exercise to study what each operator does.
Wrap Up
This article shows you how I have used SQL Sentry Plan Explorer to view Estimated and Actual Execution Plans. One of the coolest features is the Anonymize button so you can share with others without compromising confidential information. SQL Sentry Plan Explorer has a number of views available to help you understand the rich information stored within Execution Plan files. It can also provide you with additional details when you run Get Actual Plan on the query directly. This is of course, a mere introduction of what SQL Sentry Plan Explorer can do for you. Other #SQLCoop members have written a similar blog on how they have used it and what they think of it too. Check them out below:
Further Reading
 Read other #SQLCoop stories on their experience with SQL Sentry Plan Explorer here:
- SQL Sentry Plan Explorer: You can’t live without it by Jeffrey Verheul (t | b)
- SQL Sentry Plan Explorer – Don’t Leave Home Without It by Chris Yates (t | b)
A #SQLCoop team member, Mickey Stuewe (t | b), is on sabbatical this month. Hope we hear what her thoughts and experience on SQL Sentry Plan Explorer in 2015.
One response
Thanks Julie!
I have also posted a demo kit and walk-through here:
http://sqlperformance.com/2014/03/t-sql-queries/updated-plan-explorer-demo-kit